Skip to content

A lineament is a linear or gently curved feature on the Earth’s surface that is visible on satellite images, aerial photographs or elevation models and that is believed to reflect an underlying geological structure. The term was introduced to describe features such as straight valleys, aligned ridges, abrupt breaks in slope, linear vegetation or soil-moisture contrasts, and offsets in drainage that line up over distances ranging from hundreds of metres to many kilometres.
Lineaments are not automatically faults. Many are related to faults, joints, fracture zones, shear zones, dykes, lithological contacts or fold axes. Others are produced by non-geological causes such as roads, power lines, field boundaries, railways and pipelines. The central task of lineament analysis is to separate the geological signal from the noise and then to interpret what the geological lineaments mean.
Because faults and fracture zones control where mineralising fluids move and where groundwater flows, lineament mapping is one of the most widely used remote sensing techniques in mineral exploration, hydrogeology, geotechnical and hazard studies, and geothermal exploration.
Why Lineaments Matter
Mineral exploration. Many ore deposits, especially orogenic gold, hydrothermal veins and some base metal systems, form along faults and shear zones, or at their intersections and bends. Mapping lineaments over a large area highlights structural corridors and intersections that deserve follow-up. Lineament density and orientation can be compared with known deposits to identify favourable patterns.
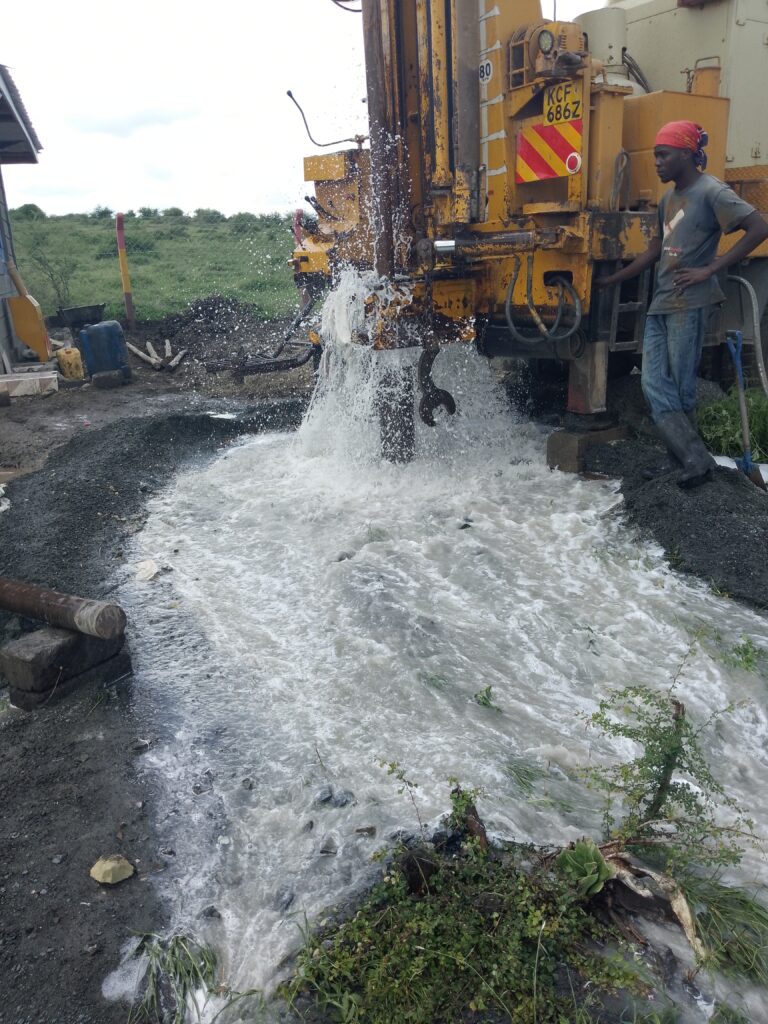
Groundwater exploration. In hard-rock terrain, such as the basement rocks of eastern and western Kenya, groundwater is stored and transmitted through fractures and weathered zones. A borehole that intersects a water-bearing fracture can yield much more than one drilled a short distance away. Lineaments guide geophysical surveys and siting. See our articles on borehole siting methods and VES.
Geotechnical and hazard assessment. Faults and fracture zones affect slope stability, foundation conditions, tunnelling and dam sites. Lineament maps support early screening of sites.
Geothermal exploration. In the Kenya Rift, faults and fissures provide permeability for geothermal fluids. Structural mapping is a key part of resource assessment.
Regional tectonics. Lineament orientations help geologists understand stress fields and the structural history of an area.
How Lineaments Appear in Remote Sensing Data
A lineament may express itself in several ways:
- Topographic expression: straight stream segments, linear valleys, aligned saddles and ridges, abrupt scarps and truncated spurs.
- Drainage patterns: abrupt bends, offsets, alignment of tributaries and sudden changes in drainage density or pattern.
- Vegetation and soil moisture contrasts: lines of denser or greener vegetation along fractures that hold water, or tonal differences in soils.
- Tonal and textural contrast: changes in image brightness or texture between rock units across a fault or lithological contact.
- Spectral differences: alteration zones along structures, visible in band ratios.
- Radar response: structures influence surface roughness and look direction effects in radar imagery.
The same lineament may be more visible in one dataset than another, which is why analysts use multiple data sources.
Data Sources for Lineament Extraction
Digital elevation models (DEMs). SRTM, ALOS PALSAR and other global DEMs, and higher-resolution local or drone-derived DEMs, are probably the single most useful data for structural mapping because they represent topography directly and are unaffected by vegetation colour or cloud. Shaded relief images (hillshades) emphasise subtle linear features.
Optical multispectral imagery. Landsat and Sentinel-2 images provide tone, vegetation and spectral contrasts at 10 to 30 m resolution. The panchromatic band of Landsat (15 m) helps sharpen detail. ASTER data add additional spectral information. See our article on remote sensing for mineral exploration.
Synthetic aperture radar (SAR). Sentinel-1, ALOS PALSAR and other radar sensors work through cloud, enhance surface roughness and relief and are especially helpful in humid and cloudy areas. Different look directions highlight different structural orientations.
High-resolution commercial imagery and aerial or drone photography. For detailed site-scale work.
Geophysical data. Airborne magnetic and radiometric surveys provide a view of structures below cover, such as dykes and faults, and can validate and extend the surface lineaments.
Existing geological maps and structural data. Mapped faults and field measurements provide ground truth.
Image Enhancement Techniques
Raw images rarely show lineaments clearly. Enhancement improves their visibility:
1. Hillshade with multiple illumination directions. A single sun azimuth hides features that run parallel to the light direction, which is called the azimuth bias. Generating hillshades from several azimuths (for example 0, 45, 90, 135 degrees, and so on) and combining them, or viewing them separately, ensures that lineaments of all orientations are revealed. Adjusting the sun elevation and vertical exaggeration also helps.
2. Directional filtering. Convolution filters, such as Sobel, Prewitt, Roberts and directional filters oriented in particular directions, enhance edges and linear features. For example, a filter tuned to north-east trends will accentuate features in that direction.
3. Edge detection. Algorithms such as Canny edge detection identify abrupt intensity changes in images and are used in automated workflows.
4. Principal component analysis and band ratios. These reduce noise, highlight spectral contrasts and bring out subtle features that may be associated with structures.
5. Contrast stretching and histogram equalisation. Simple but essential steps to improve visual interpretation.
6. Terrain derivatives. Slope, curvature, openness, topographic position index and other DEM derivatives can emphasise valleys and ridges that follow fractures.
7. Fourier and wavelet filtering. These can separate features by spatial scale and orientation and suppress noise or regular patterns such as field boundaries.
Extraction Approaches: Manual, Semi-Automatic and Automatic
Manual (visual) interpretation. An experienced geologist views enhanced images and draws lineaments as line features in GIS. This approach uses geological knowledge to distinguish geological features from cultural features and to recognise structural patterns such as en echelon arrays, offsets and splays. It is subjective, since different interpreters may map different lineaments, and time-consuming over large areas, but it remains the benchmark for quality, particularly when combined with field knowledge.
Automated extraction. Software algorithms detect linear features and vectorise them. Common tools include:
- LINE module in PCI Geomatica, a widely cited automated lineament extraction algorithm based on edge detection, thresholding and curve extraction.
- Hough transform-based methods, which detect straight-line segments in edge images.
- Open-source implementations in Python or in GIS software (for example using edge detection and line segment detectors available in image processing libraries) and plugins in QGIS and other platforms.
- Machine learning and deep learning approaches, in which convolutional neural networks are trained on examples of mapped structures to recognise lineaments in new imagery. These are an active research area, closely related to the GeoAI methods discussed in our other articles.
Automated methods are fast and reproducible and can process very large areas, but they produce many false positives (roads, fences, field edges) and fragment real lineaments into short segments. Parameters such as thresholds and minimum length strongly influence the result.
Semi-automatic (hybrid) approach. In practice, many geologists run an automatic extraction first to generate candidate lineaments, then edit them by hand: removing artefacts, joining fragments and adding missed features. This combines efficiency with geological judgement, and is often the best compromise.
A Step-by-Step Lineament Extraction Workflow
Step 1: Define the objective and scale. Are you mapping regional structures for exploration targeting, or local fractures for borehole siting? The objective determines the data resolution and the minimum lineament length of interest.
Step 2: Select and prepare data. Choose DEMs and imagery suited to the scale. Reproject to a common coordinate system, mosaic tiles, fill DEM sinks if necessary and clip to the study area.
Step 3: Enhance. Produce multi-azimuth hillshades, apply directional filters, create band composites and ratios, and compute terrain derivatives.
Step 4: Mask non-geological features. Overlay roads, rail lines, canals, power lines, field boundaries, settlements and other cultural features, which are often available from open map data, and exclude them or flag them for removal.
Step 5: Extract lineaments. Draw manually, run an automated algorithm or combine both. Record the data source and parameters for each lineament.
Step 6: Edit and clean. Remove cultural artefacts, merge collinear segments, delete very short features below the chosen length threshold, and fix topology.
Step 7: Classify and attribute. Assign attributes such as length, azimuth, confidence level (for example definite, probable or possible) and the interpreted type (fault, fracture zone, dyke, contact).
Step 8: Analyse. Compute:
- Rose diagrams showing the distribution of lineament orientations, which indicate dominant structural trends.
- Lineament density maps, showing total lineament length per unit area. High-density areas may mark intensely fractured zones.
- Lineament intersection density, highlighting crossing points of structures, which are often favourable for fluid flow, mineralisation and groundwater.
- Relationship to geology, drainage, geophysical anomalies, mineral occurrences, borehole yields and known faults.
Step 9: Validate. Compare with mapped faults, field structural measurements, geophysical data, borehole yields or drilling results. Visit key lineaments in the field to confirm whether they are geological structures and to measure orientation, dip and kinematics.
Step 10: Integrate and report. Use the results to rank targets for exploration or borehole siting, and document the methods, data and uncertainties.
Interpreting Lineaments Geologically
A lineament map is only the beginning. Interpretation asks:
- What kind of structure is it? A fault, a joint set, a shear zone, a dyke or a lithological boundary? Offsets, curvature, linearity over long distances and association with geophysical anomalies help decide.
- What is the age and kinematics? Cross-cutting relationships and offsets reveal relative age, and field measurements reveal movement direction.
- How does it relate to regional tectonics? In East Africa, structures related to the East African Rift, older Precambrian shear zones and reactivated structures all produce lineament systems with different orientations.
- Is it open or sealed? For groundwater and fluid flow, open, extensional fractures are favourable, whereas fractures filled with clay, quartz or fault gouge may act as barriers.
- How does it connect with other structures? Fault intersections, splays and jogs create zones of increased permeability and dilation.
For example, in Kenya’s basement terrain, a group of north-south trending lineaments crossed by north-west trending structures may define intersections where fracture density and weathering are high, giving good groundwater prospects. In orogenic gold systems, lineaments parallel to regional shear zones with bends and dilational jogs are classic exploration targets.
Using Lineaments for Groundwater Targeting
Studies in many countries have shown a statistical relationship between lineament density, lineament intersections and borehole yield in hard rock aquifers, although the relationship is not universal. In practice, hydrogeologists use lineaments to:
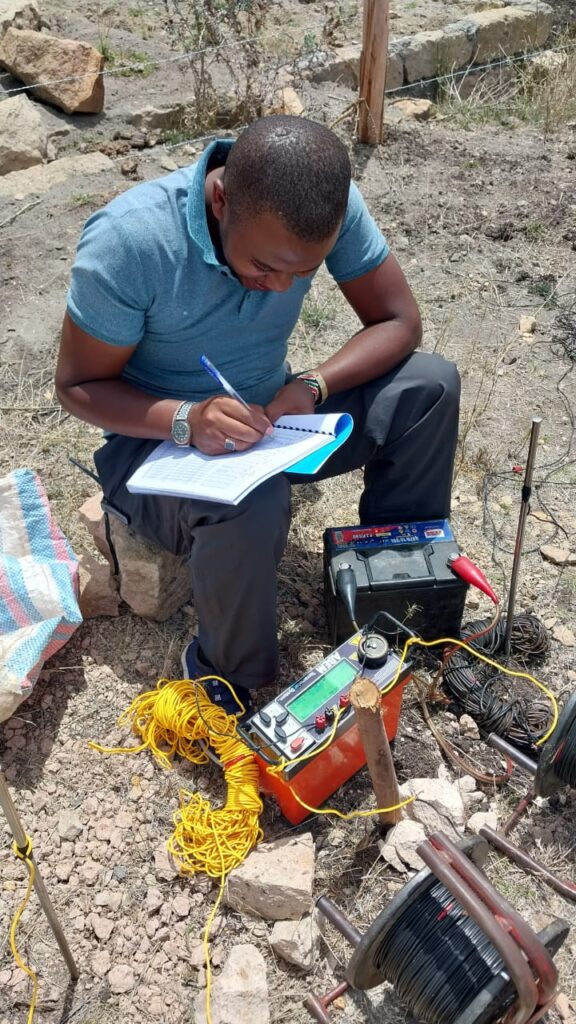
- Select areas for geophysical profiling (resistivity or EM lines crossing the lineament).
- Prioritise zones for detailed survey in large properties.
- Interpret VES and ERT results in the structural context.
- Build groundwater potential maps in GIS, where lineament density is one of the weighted layers.
Local calibration is essential. Not every lineament is productive, and some are dry or clay-sealed. Always confirm with geophysics and local borehole data. See our groundwater potential mapping article.
Using Lineaments for Mineral Targeting
In exploration, lineament analysis is combined with:
- Alteration mapping from multispectral data to find structures with associated alteration.
- Geochemical anomalies such as soil or stream sediment gold or pathfinder elements, which may align along structures.
- Geophysics, especially magnetics and radiometrics, to confirm structures beneath cover.
- Known deposits and occurrences, to test whether mineralisation clusters along particular lineament trends or intersections.
Statistical methods, such as weights-of-evidence and machine learning, can quantify the spatial association between lineaments and deposits and incorporate lineament features into prospectivity models. See our article on machine learning for mineral prospectivity mapping.
Limitations and Common Pitfalls
- Subjectivity and bias. Different interpreters map different features, and illumination direction biases visual detection.
- Scale dependence. The lineaments you see depend on image resolution and the display scale.
- Non-geological features. Roads, fences, power lines, canals and land-use boundaries can be mistaken for lineaments.
- Cover and vegetation. Thick soil, regolith, sediments and vegetation can mask structures, so absence of lineaments does not prove absence of structure.
- Lineament is not equal to fault. Interpretations need geological support.
- Orientation bias in automated methods. Some algorithms favour certain directions or fragment features.
- Over-interpretation. A map with thousands of lineaments may look impressive but may include many irrelevant lines. Use confidence levels and focus on the geologically meaningful ones.
- Uncertainty in positional accuracy. Mis-registration between datasets can shift lineaments and affect correlations with boreholes or samples.
Good practice is to treat lineaments as hypotheses to be tested, not as facts.
Tools and Software
- QGIS and GRASS GIS: hillshade generation, filters, terrain analysis and vector editing, with plugins and scripts for line detection.
- ArcGIS: raster processing, edge filters and vector editing.
- PCI Geomatica (LINE module), ENVI and ERDAS IMAGINE: commercial remote sensing packages with lineament extraction tools.
- Python: libraries such as scikit-image, OpenCV, Rasterio and GeoPandas for automated extraction and analysis.
- Rose diagram and stereonet tools: for orientation analysis, available in specialised geological software and open-source packages.
- Google Earth Engine: for processing large datasets, including DEM derivatives and imagery composites.
Frequently Asked Questions
Is a lineament the same as a fault? No. Some lineaments are faults, others are fractures, dykes or contacts, and some are not geological at all.
Which data is best for lineament extraction? DEMs with multi-directional hillshades are a strong foundation, complemented by optical and radar imagery and geophysical data.
Can I do it with free data and software? Yes. SRTM or ALOS DEMs, Sentinel and Landsat imagery, and QGIS or Python are enough for professional-quality results.
How accurate are automated lineament maps? They are useful for first-pass screening but require manual editing and validation.
Do lineaments guarantee water or minerals? No. They indicate where structures may occur, increasing the probability of finding groundwater or mineralisation, but must be validated with field work and geophysics.
Conclusion
Lineament extraction from satellite data turns images and elevation models into structural maps that guide exploration, borehole siting and engineering decisions. By combining multi-azimuth enhancement, careful manual and automated extraction, geological interpretation and field validation, geologists can reveal the fault and fracture systems that control mineralisation and groundwater. The key is to treat lineaments as clues, apply geological judgement and always test the interpretation with ground evidence.
For lineament analysis, structural interpretation, GIS and remote sensing services, contact Reg. Geol. Mbugua Githae (MGSK) through consult.innercoregeoconsultants.co.ke.