 Skip to content
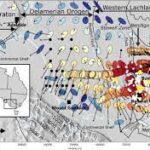
Geological maps are more than just colorful diagrams — they are powerful tools that narrate the history of the Earth’s crust. To a trained eye, they reveal patterns of deformation, stratigraphy, mineralization, and potential hazards. For students, prospectors, engineers, or policymakers, understanding how to read and interpret a geological map can open doors to informed decisions about land use, mining, infrastructure development, and environmental protection.
In this blog post, we guide you from the basics of reading geological maps to advanced interpretation techniques, helping you move from a beginner to a confident practitioner.
What Is a Geological Map?
A geological map is a visual representation of the types, distribution, and relationships of rock units exposed at or beneath the Earth’s surface. It shows:
- Rock types and their ages
- Structural features like faults, folds, and lineaments
- Geological boundaries
- Topographic information
Geological maps often include cross-sections and legends that provide additional clarity.
They are indispensable in:
- Mineral exploration
- Engineering geology
- Hydrogeology
- Environmental assessments
- Land use planning
1. Understanding the Key Components
Let’s break down the main elements of a typical geological map:
🗺️ a) Base Map and Scale
Geological maps are overlaid on topographic base maps. The scale indicates the level of detail.
- Large-scale maps (e.g., 1:25,000) show more detail, ideal for fieldwork and local projects.
- Small-scale maps (e.g., 1:250,000) show regional trends and broad structures.
Topographic features—rivers, roads, hills—help orient you on the ground.
🧭 b) Legend and Color Coding
Each color or pattern on the map represents a different rock type or formation. These are described in the legend or key, which also includes:
- Lithology (rock type)
- Age of the formation
- Unit symbols (e.g., “Kls” = Cretaceous limestone)
The map legend is your primary guide—always study it carefully.
🧱 c) Geological Units and Contacts
Boundaries between rock units are called contacts. They may be:
- Conformable contacts: Gradual transitions in sedimentary layers
- Unconformities: Gaps representing erosion or non-deposition
- Fault contacts: Where rocks have been displaced
Lines separating units are either solid (well-defined) or dashed (inferred).
⛏️ d) Structural Symbols
Geological maps use symbols to depict structural data:
- Strike and dip: Orientation of rock layers
- Fold axes
- Fault lines (with movement indicators)
- Lineations and foliation
These symbols are often plotted with orientation measurements, such as “N45°E/30°SE,” indicating the strike and dip of bedding.
2. Reading a Map Like a Geologist: Step-by-Step
Step 1: Locate Yourself
Start by finding known landmarks — towns, rivers, roads — and determine your current location on the map. This helps orient your direction of travel.
Step 2: Identify Rock Units
Use the legend to interpret the colored zones. Understand the rock types, their ages, and their spatial relationships. Are there more volcanic rocks? Sedimentary sequences? Intrusions?
Step 3: Recognize Contacts and Boundaries
Look for transitions between units. Sharp lines could indicate faults; curvy, parallel bands may suggest folded strata.
Step 4: Analyze Structural Features
Read strike and dip symbols to understand how rocks are tilted or deformed. Faults often cut across rock units and may be associated with mineral deposits or groundwater movement.
Step 5: Look for Patterns
Geologists look for structural patterns:
- Repeated sequences? This may indicate folding.
- Offset units? It could mean faulting.
- Isolated patches? Possible erosional remnants or intrusions.
Step 6: Cross-Reference with a Geological Cross Section
Many geological maps include a vertical cross-section showing what lies beneath the surface. Use it to understand how surface features extend underground.
3. Types of Geological Maps
📍 a) Bedrock Maps
Show the solid rocks beneath the soil and superficial deposits. Useful for mining and construction.
🌾 b) Surficial Maps
Depict recent unconsolidated materials like soils, alluvium, and glacial deposits. Useful for agriculture, hydrogeology, and engineering.
🧲 c) Thematic Maps
Include maps focused on:
- Structural features (fault maps)
- Mineral occurrences
- Geophysical anomalies (magnetic or gravity maps)
- Hydrogeology (aquifer extent, groundwater flow)
4. Practical Application: Mineral Exploration
In mineral prospecting, geological maps help identify:
- Ore-hosting formations
- Structurally controlled mineralization (e.g., shear zones, veins)
- Favorable geological environments (greenstone belts, fold belts)
By overlaying geochemical and geophysical data on geological maps, exploration geologists pinpoint drilling targets and avoid unnecessary costs.
Example:
In parts of the Lake Victoria Goldfields in Kenya and Tanzania, gold is typically found along NE-SW trending shear zones in greenstone belts. Geological maps highlight these zones and their relationships with banded iron formations and volcaniclastics.
5. Advanced Interpretation Techniques
a) Stereonet Analysis
Used to analyze orientation data (strike and dip) to understand folding, faulting, and stress regimes. Plotted on stereonets or rose diagrams.
b) Digital Mapping with GIS
Modern maps are digitized and used in QGIS or ArcGIS for spatial analysis. You can:
- Create 3D geological models
- Overlay satellite imagery
- Conduct terrain analysis
- Integrate borehole data
c) Cross-Section Construction
By projecting surface data vertically, geologists reconstruct the subsurface. This is vital for planning tunnels, foundations, or drilling programs.
6. Common Mistakes When Reading Geological Maps
- Ignoring the legend: Every map is different—never assume color meanings.
- Not checking the scale: Misinterpreting distance and detail can skew decisions.
- Confusing contact types: Faults vs. unconformities.
- Over-reliance on surface data: Subsurface geology can differ significantly.
- Underestimating orientation data: Strike/dip symbols tell you how the rocks are tilted or folded—ignore them, and you’re blind to the third dimension.
7. Tips for Students and Beginners
- Start with a small, local map and try matching it to field observations.
- Practice identifying three rock types: igneous, sedimentary, and metamorphic.
- Learn to measure strike and dip with a compass.
- Use Google Earth alongside a geological map to visualize the terrain.
- Shadow a field geologist if possible—real-world mapping is the best teacher.
Conclusion
A geological map is not just a static representation of rocks — it’s a dynamic story of Earth’s history, structure, and processes. From prospecting for minerals to planning safe infrastructure, the ability to read and interpret these maps is a crucial skill in geology and beyond.
With time and practice, you can evolve from a beginner who sees just colors and lines to a professional who reads the Earth’s secrets embedded in every fold, fault, and formation.
Need help interpreting geological maps or training your team?
Get in touch with Geol Githae Mbugua Consultancy for customized mapping services, training sessions, and project-specific geological analysis.
📧 Email: geologist@innercoregeoconsultants.co.ke
🌐 Website: innercoregeoconsultants.co.ke
📍 Nairobi, Kenya



This blog is incredibly insightful and well-explained! It breaks down geological maps in a way that’s easy for beginners to understand while still offering advanced techniques for professionals. I really liked how it covered practical applications, common mistakes, and step-by-step interpretation. A very valuable read for students, field geologists, and anyone working in mining, engineering, or environmental planning.
This blog is incredibly and well explained it breaks down geological maps in a way easy for beginners to understand and still offering advanced for professionals
This blog is very imformative need to see more information like this