Skip to content

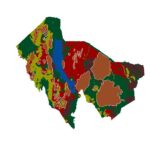
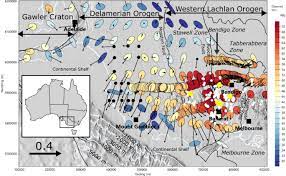
A geological map shows the distribution of rock units and surficial deposits as they would appear if soil and vegetation were stripped away. It also shows geological structures, such as faults, folds, and the orientation of layers. Importantly, it is a two-dimensional representation of three-dimensional geology. A good reader uses the map to mentally reconstruct what lies below.
Maps are interpretations, not photographs. They are drawn by geologists who observed outcrops, measured structures, and inferred what lies between and beneath. Contacts shown as solid lines are observed, and dashed lines are inferred. Understanding that difference is part of reading the map critically.
Step One: Start with the Basics
Before studying the geology, read the margins of the map. The title and sheet name identify the area. The scale tells you how much ground is represented: a 1:50,000 map shows 1 centimetre per 500 metres, while a 1:250,000 map shows 1 centimetre per 2.5 kilometres. A scale bar is more reliable than a number if the map has been enlarged or reduced. The north arrow and magnetic declination note how to align the map with a compass. The coordinate grid and datum tell you how to locate positions with GPS. The publication date, author, and source show how current and reliable the information is. Older maps may use outdated names and interpretations, so check the date.
Step Two: Study the Legend
The legend (or key) is the dictionary of the map. It lists every colour and symbol, usually organised in a column from youngest at the top to oldest at the bottom, following the principle that in undisturbed layers, younger rocks lie above older ones. Each unit has a colour, a letter code, a name, and a short description. Letter codes often hint at age and type; for example, a code might begin with a letter representing the geological period.
Units are grouped by type: sedimentary rocks (layered, formed from deposited material), igneous rocks (formed from cooled magma or lava), and metamorphic rocks (altered by heat and pressure). Surficial deposits such as alluvium, colluvium, and soil may be shown separately. The legend also explains symbols for structures, minerals, and sample points. Take time to read it, because the same colour may mean different things on different maps.
Step Three: Identify Contacts
A contact is a boundary between two rock units. Lines on the map show where contacts reach the surface. Their style conveys certainty:
- Solid lines: contact observed or well defined.
- Dashed lines: contact approximate or inferred.
- Dotted lines: contact concealed beneath cover.
Contacts can be depositional (one layer laid over another), intrusive (magma cutting into older rock), faulted (where blocks have moved), or an unconformity (a gap in the geological record). The pattern of a contact across topography helps reveal how it is oriented in three dimensions.
Step Four: Strike and Dip Symbols
Small symbols on the map show the orientation of planar features, most commonly beds, foliation, joints, veins, and faults. The standard symbol is a long line with a short tick attached.
The long line shows the strike, the compass direction of a horizontal line on the surface of the bed. The short tick points in the direction of dip, the downward slope of the bed. A number beside the symbol gives the dip angle in degrees from horizontal.
Other common symbols include a vertical bed (a long line crossed by a short perpendicular line), a horizontal bed (a circle with a cross), and overturned beds (with a hooked tick). Foliation, lineations, and fold axes have their own symbols, all explained in the legend.
Step Five: Read the Outcrop Pattern and the Rule of V’s
The shape of a contact line is controlled by the way the contact is oriented relative to the topography. This gives rise to the rule of V’s, one of the handiest tools in map reading.
- Horizontal layers produce contacts that follow topographic contour lines, creating dendritic (branching) patterns in valleys.
- Vertical layers produce straight contacts that ignore topography.
- Dipping layers produce V-shapes where contacts cross valleys. In general the V points in the direction of dip. If layers dip upstream, the V points upstream. If layers dip downstream more steeply than the stream gradient, the V points downstream. If they dip downstream but more gently than the stream gradient, the V points upstream, against the dip.
A shallowly dipping contact has widely wandering V’s, while a steeply dipping one has narrow, straighter V’s. By reading these shapes and the strike and dip symbols, you can estimate the dip direction and angle even where no symbol is given.
Step Six: Recognise Folds
Folds appear as repeated bands of rock units arranged symmetrically around a central line, the fold axis trace.
- In an anticline, the oldest rocks lie in the centre, and the beds dip away from the axis on both sides.
- In a syncline, the youngest rocks lie in the centre, and the beds dip toward the axis.
If the fold axis is horizontal, outcrop patterns are parallel bands. If the axis plunges, the bands curve around to form nose-shaped closures (V or U shapes) at the end of the fold. The direction in which the nose points shows the plunge direction for an anticline, and the opposite for a syncline. Fold symbols on the map show the axis trace with arrows indicating limb dip direction and plunge.
Step Seven: Recognise Faults
Faults appear as lines cutting across rock units, often marked by thick or distinctive line styles and symbols indicating the type of movement.
- A normal fault is usually shown with small ticks or bars on the downthrown side.
- A thrust fault is shown with triangles (teeth) on the upper (hanging wall) side, pointing in the direction of movement.
- A strike-slip fault is shown with paired arrows indicating the relative movement direction.
Look for offset of contacts or units across a line, abrupt termination of units, or repetition or omission of layers. If a unit appears displaced sideways across a line, that is a strong sign of strike-slip movement. If units are missing or repeated, dip-slip movement may be involved. Faults cutting units of different ages can also help establish the relative timing of events: a fault that cuts a unit must be younger than that unit, and one that is truncated by a unit must be older.
Step Eight: Look for Unconformities and Intrusions
An unconformity is a surface of erosion or non-deposition separating younger rocks from older rocks. On a map, it appears as a contact where younger layers overlie older layers at an angle, or where a large age gap exists. Intrusions, such as granite bodies, dykes, and sills, appear as irregular or elongated patches of igneous rock cutting through other units. Dykes appear as narrow, often straight lines crossing older rock patterns, and they are younger than the rocks they cut. Heated and altered zones around intrusions, called contact aureoles, may be shown or described in the legend.
Step Nine: Use the Topography
Many geological maps use topographic contours beneath the colours. Learn to read these as well: closely spaced contours mean steep terrain, and widely spaced contours mean gentle terrain. Matching geological boundaries with topographic features such as ridges, valleys, and scarps helps interpret how resistant rocks form ridges and weaker rocks form valleys. In the Kenyan Rift, for instance, hard lava flows often cap scarps, while softer sediments and tuffs lie in low ground.
Step Ten: Draw or Study a Cross-Section
Many maps include a cross-section along a line marked on the map (A to A’). A cross-section is a vertical slice showing how units are arranged beneath the surface. If one is not provided, you can construct a simple one: draw a profile of the topography along the line, mark where contacts cross the line, project dips from strike and dip symbols, and connect contacts with smooth curves consistent with the dips. This exercise reveals whether your interpretation of folds and faults makes sense in three dimensions.
Tips for Reading Kenyan Geological Maps
Older Kenyan maps, produced from mid-twentieth century surveys, use formation names and codes that may differ from modern usage, so read the accompanying report where possible. Volcanic areas of the Rift display complex patterns of lavas, tuffs, and sediments with faults cutting through them. Basement areas show metamorphic rocks with foliation trends and shear zones. Maps may differ in detail between regions, since they were produced in several phases. Always check the date, scale, and the reliability diagram or notes, and consider supplementing the map with satellite imagery and geophysical data.
Common Mistakes
Frequent mistakes include confusing contact lines with faults, ignoring the legend order, misreading the strike and dip tick direction, assuming that map colours are consistent across different sheets, and forgetting that the map shows only the surface geology. Another is treating inferred contacts as certain, or ignoring the date and scale of the source.
Frequently Asked Questions
Do I need a geology degree to read a map? No. A solid grasp of the legend, symbols, and basic rules lets anyone extract useful information.
What is the best way to practise? Take a small area map, draw a cross-section, and compare with satellite imagery or a visit to the field.
Why do maps from the same area look different? They may differ in scale, date, interpretation, and the units chosen.
Conclusion
Reading a geological map is a skill built on a handful of principles: understand the legend and scale, follow the contacts, interpret strike and dip, apply the rule of V’s, recognise folds and faults, and build cross-sections. With practice, the colourful patchwork becomes a clear story of how the landscape formed. In Kenya, from the volcanic Rift to the ancient basement and greenstone belts, that story guides mineral exploration, water supply, engineering, and land-use decisions.