Skip to content


Geology is a spatial science. Rocks, faults, soils, drill holes, samples, boreholes and mineral occurrences all have a location, and the relationships between them often matter more than any single observation. A Geographic Information System (GIS) is software that stores, displays, analyses and communicates location-based data. For a geologist, it is the modern equivalent of a field notebook, a map table and a calculator combined.
GIS is used across the geoscience disciplines: geological mapping, mineral exploration, hydrogeology and borehole siting, geotechnical site investigation, environmental assessment, natural hazard mapping and renewable energy site selection. A geologist who can build a clean GIS project can integrate data from field work, laboratories, geophysics and satellites, and can produce maps and reports that clients, regulators and investors trust.
Core GIS Concepts Geologists Should Understand
Vector data. Points, lines and polygons. In geology, points represent samples, outcrops, boreholes and structural measurements, lines represent faults, contacts and traverses, and polygons represent rock units, concessions, soil units and alteration zones. Each feature carries an attribute table with fields such as rock type, age, sample ID, assay value or dip and strike.
Raster data. Grids of cells (pixels), each holding a value. Examples include satellite images, digital elevation models (DEMs), geophysical grids (magnetics, radiometrics), geochemical interpolation surfaces and prospectivity maps. Resolution (cell size) controls the level of detail.
Coordinate reference systems (CRS). The mathematical framework that places data on the earth. Errors in CRS are the most common cause of “my data does not line up” problems. In Kenya, projects commonly use WGS 84 geographic coordinates (EPSG:4326) and UTM projections, with Kenya falling across UTM zones 36 and 37 (north and south hemispheres) because the country straddles the equator and spans longitudes from about 34 to 42 degrees east. Always record the CRS and datum in your metadata, and confirm them when receiving data from clients, surveyors or government agencies.
Topology and data quality. Polygons should not overlap or leave gaps unless intended, and lines should connect where faults and contacts meet. GIS tools can check and enforce these rules, which is vital for geological maps that must be internally consistent.
Metadata and data management. Document where each dataset came from, its date, accuracy and licence. Good data management saves weeks of confusion later.
Essential Data Sources for Geologists
- Digital elevation models: SRTM and ALOS data are widely used worldwide, and other global DEMs are available. They support terrain analysis, drainage extraction and structural interpretation.
- Satellite imagery: Sentinel-2, Landsat and ASTER for geological and alteration mapping, and radar data such as Sentinel-1 for structure and surface roughness. See our remote sensing article.
- Geophysical data: airborne magnetic and radiometric surveys, where available, and ground geophysics such as resistivity and induced polarisation.
- Geological maps and reports: national geological survey maps, published literature and previous exploration reports, which are often scanned and need georeferencing.
- Field data: GPS tracks, structural measurements, photos, sample locations and notes collected in the field.
- Laboratory data: geochemical assays, petrography, geochronology and groundwater chemistry.
- Borehole and drill-hole data: collars, surveys, lithology logs, assays and water strike information.
- Cadastral and administrative data: licences, concessions, protected areas, land use, settlements and infrastructure.
Always check licences and usage terms. Some data are free and open, others restricted.
A Practical GIS Workflow for Geologists
The details differ between projects, but a robust workflow follows the same logic.
Step 1: Define the question and the deliverables. Be clear about what you need to answer: Where are the structural targets? Which areas have the best groundwater potential? Where should we sample next? The question determines which data and methods you need, and the final maps and reports you must produce.
Step 2: Set up the project. Create a project folder with a clear structure (raw data, processed data, outputs, documents). Choose a project CRS, set up a geodatabase (such as GeoPackage or PostGIS) and adopt consistent file naming. Version control of important layers prevents accidental overwriting.
Step 3: Acquire and import data. Download or collect data, convert it to usable formats, and import it into the project. Georeference scanned maps by tying them to known control points, and check the residual errors. Reproject datasets into the project CRS.
Step 4: Clean and validate data. Remove duplicates, fix geometry errors, standardise attribute values (for example consistent lithology names) and check for outliers. For geochemical data, deal with below-detection-limit values in a documented way. Quality control at this stage prevents misleading analyses later.
Step 5: Explore and visualise. Plot points on imagery and geology, classify symbols by attributes, create hillshades from DEMs, and look at the patterns. Exploratory work often reveals data problems and generates hypotheses.
Step 6: Analyse. Apply spatial analysis methods suited to the question (see below).
Step 7: Integrate and interpret. Combine layers, compare patterns with geological models and use expert judgement. GIS supports interpretation but does not replace it.
Step 8: Validate with field data or drilling. Check predictions against independent observations, and refine the model.
Step 9: Produce maps, reports and data deliverables. Create professional layouts with scale bars, north arrows, legends, coordinate grids and source credits. Export data in formats the client can use. Document the methods so that results can be reproduced.
Step 10: Archive. Store the final project, data and documentation safely, with backups.
Common Geological GIS Tasks and How to Do Them
Geological mapping and compilation. Digitise contacts and faults from field notes, imagery and published maps. Use topology rules to keep polygons clean. Symbolise structural measurements (strike and dip symbols) using rotation by attribute. Build a stratigraphic legend and a consistent style to produce a final geological map.
Structural analysis. Extract lineaments from DEMs and imagery, calculate their orientations and lengths, create rose diagrams, and relate lineament density to mineralisation or groundwater. Overlay faults with geochemical anomalies and drill results to identify structural controls. See our lineament extraction article.
Geochemical analysis. Interpolate soil or stream sediment assays into surfaces using methods such as inverse distance weighting or kriging, identify anomalies by thresholding and classify them statistically, and compare them with geology and structure. Be cautious about interpolating over large gaps or between different sample media.
Geophysical data integration. Display magnetic and radiometric grids, apply enhancement filters (such as vertical derivative or analytic signal) in specialised software or GIS plugins and compare them with geology to map lithology, structure and alteration.
Hydrogeological siting and groundwater potential mapping. Combine geology, lineaments, slope, drainage density, rainfall, soil and land cover layers using weighted overlay, then validate against existing borehole yields. See our groundwater potential map article.
Drill planning and 3D context. Plot collars and traces, display down-hole data and project assays to sections. Many geologists export from GIS into specialised 3D modelling software for resource work and then return the results to GIS for mapping and reporting.
Terrain and hazard analysis. Derive slope, aspect, curvature and flow accumulation from DEMs. Use them to assess landslide susceptibility, flood hazard, erosion and site suitability for infrastructure such as roads, dams or solar plants.
Environmental and social screening. Overlay concessions or project areas with protected areas, water bodies, settlements and land use to support environmental impact assessment and community engagement.
Tools: Free, Open-Source and Commercial
QGIS (free, open source). A full-featured desktop GIS widely used by geologists, with a large library of plugins. It handles vector and raster data, georeferencing, map layouts, terrain analysis and many geoscience tasks. Useful plugins and integrations include the Semi-Automatic Classification Plugin for satellite imagery, tools for stereonet and structural data, and links to GRASS GIS, SAGA GIS and GDAL processing algorithms.
ArcGIS (Esri, commercial). A widely used professional platform with powerful analysis, cartography and enterprise integration, including ArcGIS Pro, extensions for spatial analysis and the ArcGIS ecosystem for web and mobile data collection. Many mining companies and government agencies use it.
GRASS GIS and SAGA GIS (free). Strong for raster analysis, terrain modelling, hydrology and geostatistics, and accessible from within QGIS.
Google Earth Engine (free for many research and non-commercial uses; commercial options exist). A cloud platform for processing large satellite datasets with scripting, ideal for time series, large areas and band-ratio or classification analyses. Check licence terms for commercial use.
ENVI and ERDAS IMAGINE (commercial). Specialised remote sensing software with strong spectral analysis tools for mineral mapping from multispectral and hyperspectral data. Open-source alternatives exist, such as SNAP (from ESA) and Python libraries.
Geosoft Oasis montaj and similar (commercial). Industry-standard for geophysical data processing, widely used in mineral exploration.
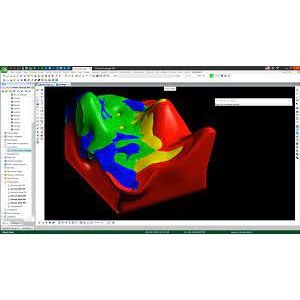
Leapfrog, Micromine, Surpac, Datamine and similar (commercial). 3D geological modelling and mining software for drill-hole data, resource estimation and mine planning, usually linked with GIS.
Python and R. Programming languages with strong geospatial and statistical libraries (for example GeoPandas, Rasterio, Shapely, scikit-learn, PyGMT, and R packages for geostatistics). They allow reproducible, automated workflows and are central to GeoAI and machine learning. See our GeoAI articles.
Field data collection apps. Tools such as QField, Mergin Maps, ArcGIS Field Maps, Fulcrum and others allow geologists to collect points, photos and attributes on phones or tablets with GPS and sync to a central database. They reduce transcription errors and speed up data availability.
Handheld and survey-grade GPS and total stations. For higher accuracy needs, such as geotechnical investigations and borehole surveys.
Choosing tools depends on budget, project type, client requirements and your team’s skills. Many professionals combine open-source and commercial software.
Best Practices for Geological GIS
- Keep raw data untouched and work on copies.
- Standardise attribute tables using controlled vocabularies and unique IDs.
- Document every step, including parameters and decisions, so others can reproduce the work.
- Respect scale. Do not display or interpret data at a scale much finer than its accuracy supports.
- Understand error and uncertainty. GPS errors, map digitising errors and interpolation errors all affect results. Report uncertainty where possible.
- Use consistent symbology and legends that follow recognised geological map conventions.
- Back up regularly and use a shared geodatabase for team projects.
- Combine GIS output with field verification. Maps are models, not facts.
- Protect sensitive data, such as exploration targets and community information.
- Keep learning. Tools and methods evolve rapidly, particularly in remote sensing and machine learning.
Common Mistakes to Avoid
- Mixing coordinate systems and datums without checking.
- Overlaying layers of very different scale and accuracy and treating the result as precise.
- Relying on automated classification or interpolation without geological reasoning.
- Producing attractive maps with no metadata, scale or source information.
- Ignoring the quality of base data, such as poorly georeferenced old maps.
- Trying to do everything in one huge project file with no structure.
Skills to Build as a Geologist
If you are building GIS skills, a sensible progression is: basic navigation and symbology in QGIS, data management and CRS, georeferencing and digitising, spatial analysis, raster and terrain analysis, remote sensing basics, scripting in Python, and finally advanced topics such as machine learning and 3D modelling. Practise on real projects, such as mapping a local area or compiling borehole data.
Frequently Asked Questions
Do I need to buy expensive software to start? No. QGIS is free and capable of professional work. Commercial tools may be required by employers or clients for specific workflows.
Is GIS the same as remote sensing? No. Remote sensing is the science of acquiring information from satellites or aircraft, while GIS is the system for managing and analysing spatial data. They are used together.
What is the difference between GIS and CAD? CAD focuses on drawing and design, while GIS links geometry to attributes and supports spatial analysis on real-world coordinates.
How accurate is GPS data from a phone? Typically a few metres under good conditions, worse under tree cover or in steep terrain. For high-precision work, use survey-grade equipment.
Can GIS predict where minerals or groundwater occur? GIS can combine evidence to produce prospectivity or potential maps, but predictions depend on data quality and geological understanding, and must be validated.
Conclusion
GIS has become an essential tool in the geologist’s toolkit. By mastering core concepts, following a structured workflow and choosing the right tools, you can integrate field, laboratory, geophysical and satellite data into clear, defensible maps and decisions, whether you are targeting a gold-bearing shear zone, siting a borehole or assessing a construction site.
For GIS mapping, remote sensing, structural geology and geological mapping services, contact Reg. Geol. Mbugua Githae (MGSK) via consult.innercoregeoconsultants.co.ke.