Skip to content

Drill target generation using structural geology means using the shape, orientation and movement history of faults, folds and veins to decide where mineralised fluid most likely collected, and therefore where to put the first drill hole. In orogenic gold terrains, such as the greenstone belts of East Africa, structure is often the single most important control on where gold sits. This article explains the workflow in plain terms for students, junior geologists and investors.
Start with the Mineral Systems Approach
A mineral system asks five questions: where did the fluids and metals come from, what pathways carried them, what drove the flow, where did they stop and drop their metal, and was the deposit preserved? Structural geology answers mostly the pathway and trap questions. Faults and shear zones act as plumbing, and bends, intersections and rock contrasts act as traps.
Thinking this way keeps targeting honest. A fault with no link to a likely metal source or no favourable trap is only a line on a map.
Read the Regional Lineaments from Magnetic Data
Regional magnetic maps reveal long linear features that mark faults, shear zones, dykes and contacts between rock units. Geologists trace these as lineaments and ask which are old, deep structures that could have tapped fluids. Crustal-scale breaks that cut a greenstone belt often act as the main pathways. Gold deposits then tend to cluster on smaller structures near them, so the regional pattern tells you which belt corridors to focus on.
Kenya’s national airborne geophysical survey, discussed in our geophysics article, gives a countrywide magnetic dataset that can be used for this first-pass interpretation.
Find Shear Zones and Dilational Jogs
A shear zone is a band of rock deformed by sideways or oblique movement. Where a fault changes direction or steps across to a parallel fault, the movement can open space. This is called a dilational jog (a releasing bend or step-over). Open space lowers fluid pressure, so fluids rush in, change chemistry and deposit quartz and gold. Mapping the sense of movement tells you which bends open and which squeeze shut. The same bend can be a good trap or a poor one, depending on kinematics.
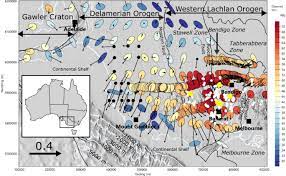
A published study of the Bardoc and Boulder-Lefroy shear systems in Western Australia (Morey and others, 2007) is a useful case. The more geometrically complex, narrower shear system, with antiforms and splay faults that favoured dilation, hosted far more gold than the simpler, broader one. The authors also note that structure is not the only factor.
Look for Fold Hinges and Fold-Fault Intersections
Folds bend layers. In the hinge zone of a fold, layers can separate and open space can form, so veins and gold often concentrate there. Where a fault cuts a fold, or two faults cross, permeability is highest and fluids focus. Fold-fault intersections are classic targets because they combine a trap shape with a pathway. In many belts, mineralised intersections also plunge in one consistent direction, which brings us to shoots.
Work Out Kinematics and Vein Orientation
Kinematics is the movement history: which way blocks moved and in what order. Geologists work it out from offset markers, drag folds, slickensides, and the geometry of vein sets. In a shear zone, vein sets often form at predictable angles to the main fault. Extension veins, flat to shallow-dipping veins and ladder veins each tell you the stress direction when they opened. Once you know the stress field, you can predict which structure orientations were open during gold deposition and which were closed.
Take Structural Measurements and Use Stereonets
Collect dip and dip direction (or strike and dip) of foliation, veins, faults and fold axes in outcrop, pits, trenches and oriented core. A stereonet is a circular diagram that plots the orientation of planes and lines in a standard way. Plotting hundreds of measurements shows clusters: the main foliation, the vein set, the intersection lineation. The intersection of two planes is a line, and that line often gives the plunge direction of the ore shoot.
Always record the quality of each measurement and where it was taken. A sparse, well-sampled dataset beats a large messy one.
Build a 3D Model and Predict Shoot Plunge
A shoot is the elongated, higher-grade part of a mineralised structure. It is not flat but runs along a line, so a single section can mislead. Build a simple 3D model that combines surface maps, drill traces, structural data and geophysics. Test the plunge of the shoot against fold axes, intersection lineations and bends in the fault. If drilling has intersected gold in some holes and not others, the plunge often explains the pattern.
Software helps, but a hand-drawn long section can reveal the same thing.
Use Rheological Contrasts in Greenstone Belts
Rheology is how rock deforms: strong rocks break, soft rocks flow. In greenstone belts, competent units such as basalt, dolerite or banded iron formation sit next to weaker sediments or schists. Strain concentrates along their contacts, and brittle units fracture and host veins. Contacts between rock types, and the edges of intrusions, are therefore prime places for gold. Iron-rich rock can also react with fluids and help precipitate gold.
East African Context: Tanzania Craton and Western Kenya
The Archaean Tanzania Craton is a major gold province, and its greenstone belts are the model for neighbouring western Kenya. In Kenya, the Migori and Kakamega-Vihiga belts host orogenic gold in quartz veins within Nyanzian greenstones and Kavirondian sediments, and the mineralisation is structurally controlled.
A structural and geophysical study of the Migori belt by Odek (2023) reported folding and dyke-like structures, the sort of features that make fold and intersection targeting relevant. Gold at Kakamega is reported in smoky quartz veins in Kavirondian turbidites, and Shanta Gold has reported about 1.3 million ounces at 11.43 g/t gold in an underground project at Ikolomani, Kakamega. These reported figures come from public sources, not independent verification, and should be treated with care.
Integrate Geochemistry and Geophysics
Structure alone gives a hypothesis. Geochemistry and geophysics test it. A soil gold anomaly that sits on a mapped jog is stronger than either alone. Magnetics help trace faults and dykes, induced polarization can highlight sulphide-bearing zones, and radiometrics help map alteration and regolith. Overlay them in a GIS and look for coincidences along structures with the right orientation and kinematics.
Kenyan explorers should also check the Mining Cadastre portal, which is online, to see which ground is open before investing in field work. Under the Mining Act 2016, prospecting licences run up to three years, so the work programme must be planned within that window.
Rank and De-Risk Targets
Score each target against clear criteria: pathway present, trap geometry favourable, kinematics supportive, geochemical anomaly, geophysical support, drill access and land access. Give each criterion a weight and rank the results. Then list the main risks, such as thick transported cover or uncertain dip, and design cheap work to reduce them: mapping, trenching, auger drilling or a short ground geophysics line. A target that stays strong after cheap tests earns drilling money.
Design the First-Pass Drill Test
Drill holes should cross the target structure at a high angle, ideally close to perpendicular, so the true width is not overstated. If a vein dips steeply east, drill from the west towards the east at an inclined angle. Use oriented core so alpha and beta angles can be measured, and plan fences of holes at regular spacing along strike. Add at least one hole to test depth, because shoots plunge.
Keep first-pass holes modest in number and depth. Their job is to prove or reject the structural model, not to define a resource.
Conclusion
Structural geology turns a map of lines into a shortlist of drill targets. Begin with the mineral system, trace regional structures from magnetics, find the bends and intersections that open space, measure and model orientations, integrate geochemistry and geophysics, and rank the targets honestly. Then drill them at the right angle.
Sources and Further Reading
- The structural controls of gold mineralisation within the Bardoc Tectonic Zone, Western Australia (Morey, Weinberg and Bierlein, 2007)
- Structural and geophysical study of the Migori belt (Odek, 2023)
- Kakamega gold in smoky quartz veins in Kavirondian turbidites (SEKU repository)
- Shanta Gold Ikolomani underground project report (allAfrica)
- Kenya mining overview (Mayer Brown)