Skip to content

A geological map is the foundation of almost every earth-science project. Before drilling a borehole, exploring for gold, designing a dam, or assessing geothermal potential, geologists first need to understand what rocks occur where, how they are deformed, and how they relate to one another. In a country as geologically varied as Kenya, careful geological mapping can save substantial money and prevent costly mistakes.
What Is Geological Mapping?
Geological mapping is the systematic recording of rock units, structures, and surface materials across an area, presented on a base map at a chosen scale. It shows lithology (rock type), contacts, faults, folds, foliation, joints, alteration, and unconsolidated cover such as soils, alluvium, and colluvium. Supporting cross-sections show how the geology is expected to appear in the subsurface.
Types of Geological Maps
- Regional maps (1:250,000 to 1:100,000): Provide a broad framework and guide target selection.
- Detailed maps (1:25,000 to 1:5,000): Used for prospect and project areas.
- Large-scale site maps (1:2,000 and larger): Used for engineering sites, mine benches, and trench mapping.
- Thematic maps: Focus on one aspect, such as structure, alteration, hydrogeology, or geohazards.
Kenya’s Ministry responsible for mining holds regional geological maps and reports that form a valuable starting point, but they are often too coarse for project decisions and require updating.
How Geological Mapping Is Done
Desk preparation. Existing maps, satellite imagery, digital elevation models, and aerial or drone photographs are compiled. Preliminary lineament and lithology interpretations help plan traverses.
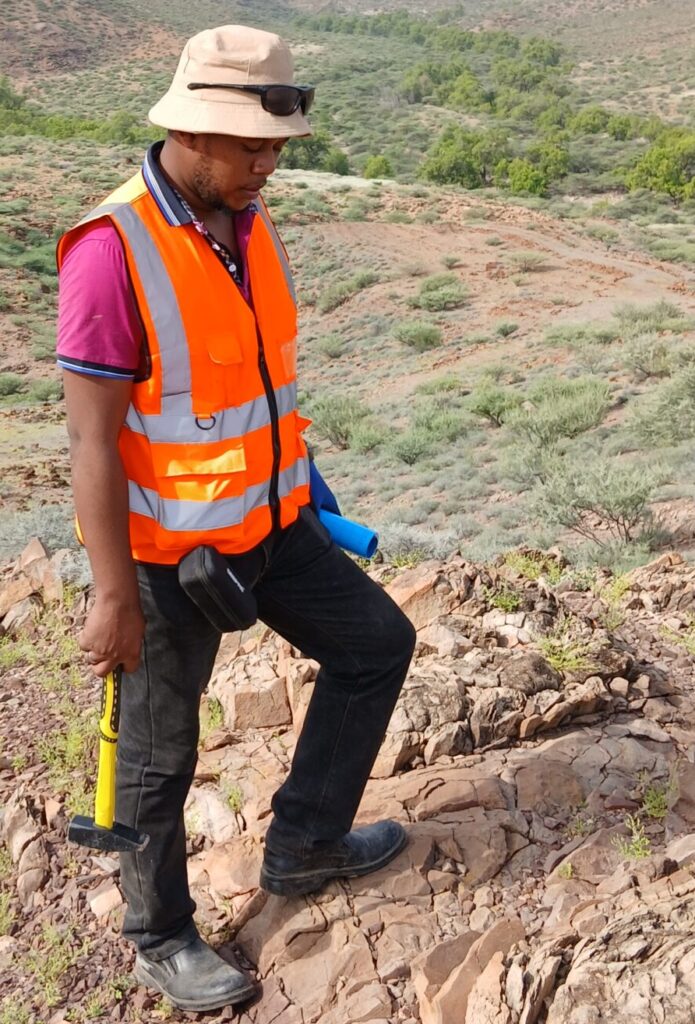
Field traverses. Geologists walk planned lines, recording outcrop observations using GPS-enabled tablets or notebooks. At each station they note rock type, mineralogy, texture, weathering, structure measurements (strike and dip), alteration, and sample locations.
Structural measurements. A compass-clinometer is used to measure planar and linear features. These data are later plotted on stereonets to identify dominant fold axes, fault orientations, and fracture sets.
Sampling. Rock samples are collected for petrography, geochemistry, or dating where required.
Data integration. Field data are digitised in GIS and combined with remote sensing and geophysical data to draw contacts and interpret structure beneath cover.
Validation. Interpretations are tested through follow-up traverses, trenches, or drilling.
Remote Sensing and Drones
Satellite imagery, such as Landsat and Sentinel data, helps distinguish rock units and alteration minerals through spectral signatures. High-resolution drone imagery produces orthophotos and elevation models that reveal small-scale structures in difficult terrain. These tools do not replace fieldwork, but they sharpen targeting and shorten field time.
Applications of Geological Mapping
Mineral exploration. Maps show host rocks, shear zones, veins, and alteration zones that control mineralisation. In greenstone belts, for example, mapping of shear zones and contact relationships between volcanic and sedimentary units guides gold targeting.
Hydrogeology. Fracture patterns, lithological contacts, and weathered zones influence where groundwater is stored and how it moves. Mapping improves borehole siting, particularly in fractured basement rocks.
Geotechnical and engineering projects. Maps identify weak rock, faults, landslide-prone slopes, expansive soils, and variable ground conditions that affect foundations, roads, and dams.
Geothermal exploration. Surface mapping of volcanic centres, faults, hydrothermal alteration, and fumaroles indicates heat sources and permeability pathways, as demonstrated across the Kenyan Rift.
Hazard assessment. Mapping helps define landslide, flood, subsidence, and volcanic hazards, supporting land-use planning.
Land and resource planning. Aggregates, building stone, clay, and sand resources can be located and quantified.
Challenges in Kenyan Terrain
- Deep weathering and soil cover: In many tropical areas, outcrop is scarce, so geologists rely on soil, float, and trench exposures, plus geophysics.
- Dense vegetation or farmland: Limits access and visibility.
- Volcanic cover: Rift volcanic sequences can hide older rocks.
- Security and access constraints: Some areas require special planning and community engagement.
Experienced mappers address these challenges by combining multiple data sets and planning fieldwork around seasons and access.
What a Good Geological Map Deliverable Looks Like
A professional mapping package typically includes:
- A geological map with legend, scale, north arrow, and coordinate system.
- One or more cross-sections.
- A structural map or stereonet summary.
- Sample location and results tables.
- Georeferenced digital files for GIS use.
- A technical report explaining methods, observations, interpretation, uncertainty, and recommendations.
Digital deliverables allow clients to integrate the work into future projects.
Cost Factors
Mapping costs depend on area size, scale, terrain, outcrop density, access, number of geologists, and the extent of sampling or geophysical support. Detailed mapping costs more per square kilometre than regional work, but it is typically one of the highest-value investments in any project because it directs all subsequent spending.
Common Mistakes to Avoid
- Relying only on old regional maps for project decisions.
- Mapping without recording structure measurements.
- Failing to link maps with sample and drilling data.
- Overinterpreting areas with little outcrop without stating uncertainty.
- Not archiving digital data.
Conclusion
Geological mapping converts scattered observations into a coherent understanding of the ground. For mineral exploration, water supply, engineering, and geothermal development in Kenya, it is the lowest-cost, highest-value first step.
Innercore Geoconsultants Services Limited provides regional and detailed geological mapping integrated with remote sensing, GIS, and geophysics. Contact us to plan a mapping programme for your project area.