Skip to content

Drilling a borehole tells you whether one point yields water. Aquifer mapping and characterization tells you something far more valuable: how big the aquifer is, how it behaves, how quickly it refills, and how much can be taken without harm. For schemes serving towns, farms, industries, or whole communities, this knowledge is essential to avoid over-abstraction and failure.
What Is an Aquifer Characterization?
Aquifer characterization is the process of defining the physical, hydraulic, and chemical properties of a groundwater system. It describes the aquifer’s geometry (extent, depth, thickness), its hydraulic properties (transmissivity, storativity), its water quality, and its recharge and discharge. The result is a conceptual and often numerical model of the groundwater system.
Why It Matters
- Sustainable supply: Sizing abstraction to what the aquifer can safely provide.
- Wellfield design: Placing and spacing boreholes to limit interference.
- Risk management: Anticipating water level decline, salinity, or contamination.
- Regulatory compliance: Supporting abstraction permits and groundwater management plans.
- Investment confidence: Providing evidence for lenders and project partners.
Key Aquifer Properties
Transmissivity (T). How easily water moves through the full thickness of the aquifer. It combines permeability and thickness, and is derived mainly from pumping tests.
Storativity (S). The volume of water an aquifer releases per unit area per unit decline in water level. Confined aquifers have low storativity, while unconfined aquifers have higher values.
Hydraulic conductivity (K). The permeability of the material to water.
Specific yield. The proportion of water that drains freely from an unconfined aquifer.
Recharge. The rate of water addition, controlled by rainfall, soil, vegetation, geology, and river losses.
Water chemistry. Major ions, trace elements, isotopes, and indicator parameters reveal flow paths, residence time, and contamination risk.
Data Sources and Methods
Geological and hydrogeological mapping. Defines aquifer units, structures, and boundaries, and identifies springs and discharge areas.
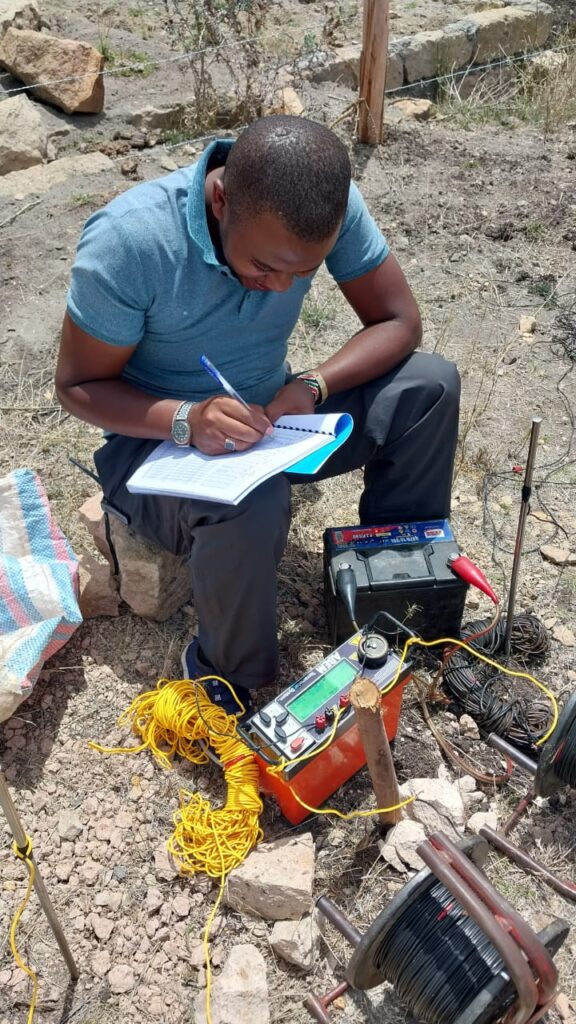
Geophysics. ERT, VES, EM, and seismic methods image aquifer geometry, thickness, and salinity distribution over large areas.
Borehole inventory. Compiling data from existing boreholes on depth, lithology, water strikes, yield, and water level provides ground truth and fills gaps in coverage.
Pumping tests. Constant-rate tests, step-drawdown tests, and recovery tests allow calculation of transmissivity, storativity, well efficiency, and boundary effects.
Water level monitoring. Regular measurements, ideally using data loggers, show seasonal and long-term trends, response to pumping, and recharge events.
Hydrochemistry and isotopes. Sampling for chemistry and stable isotopes helps identify recharge sources, mixing, salinity origins, and groundwater age.
GIS and modelling. Spatial analysis integrates all datasets into maps of aquifer extent, thickness, vulnerability, and potential. Numerical groundwater models can simulate abstraction scenarios and climate variability.
Mapping Aquifer Vulnerability and Quality
Characterisation includes identifying risks. Vulnerability mapping considers depth to water, soil type, recharge, and aquifer material to estimate how easily surface contamination could reach groundwater. Quality mapping highlights areas with high fluoride, salinity, nitrate, or iron. These maps guide where to drill and where to protect, and inform land-use planning near wellfields.
Kenyan Examples of Aquifer Settings
- Volcanic aquifers around the Rift and highlands, with fault-controlled permeability and variable quality.
- Alluvial aquifers along seasonal rivers in arid areas, rapidly recharged during floods and valuable for shallow wells and sand dams.
- Sedimentary aquifers in coastal and north-eastern basins, where deep wells may access large storage but salinity needs close attention.
- Weathered and fractured basement aquifers across large parts of the country, with highly variable yields.
Each setting needs a tailored approach to mapping and testing.
Interpreting Pumping Tests
Pumping test analysis fits observed drawdown to theoretical curves to calculate aquifer parameters. Good tests require adequate duration, stable pumping rates, accurate measurements, and observation boreholes where possible. Test results also reveal boundaries, such as impermeable barriers or recharge boundaries, that affect long-term yield.
Aquifer Management
Characterisation supports management actions:
- Setting abstraction limits based on recharge and storage.
- Spacing boreholes to reduce interference.
- Establishing monitoring networks.
- Protecting recharge zones and wellheads.
- Applying managed aquifer recharge, such as sand dams and recharge pits, where appropriate.
Common Mistakes
- Basing wellfield capacity on a single short pumping test.
- Ignoring seasonal water level variation.
- Failing to account for neighbouring abstractions.
- Overlooking water quality heterogeneity.
- Not monitoring after development.
Conclusion
Aquifer mapping and characterization provides the evidence needed to use groundwater wisely. By combining geology, geophysics, testing, and monitoring, it moves projects from hopeful drilling to managed resource development.
Innercore Geoconsultants Services Limited provides aquifer mapping, pumping test analysis, and groundwater resource assessments across Kenya. Contact us to characterise the aquifer behind your project.